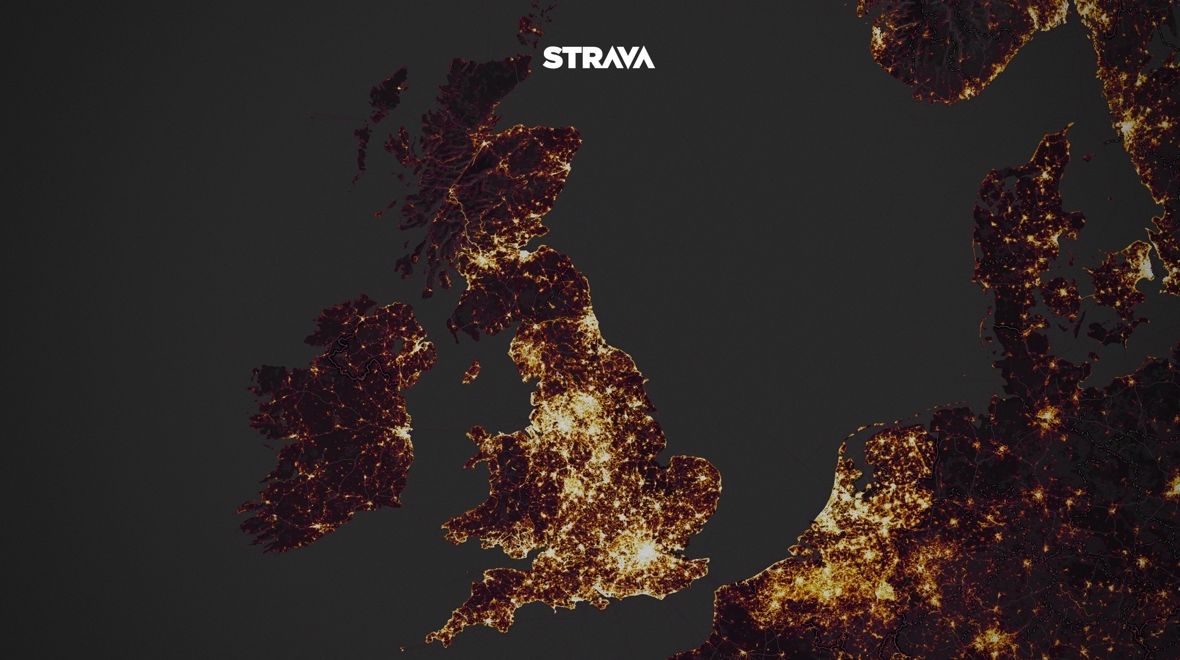

Strava has unveiled their Global Heatmap, an interactive data visualization featuring more than 1 billion activities from Strava athletes across the globe. The map boasts six times more data than the original version in 2015, and incorporates a wide variety of year-round land and water activities. Created in conjunction with Strava Metro, Strava’s heatmap is a data tool that provides a broad look at activities, popular routes and sport destinations around the world.
The Strava community has generated more than two-hundred thousand years’ worth of activity that cover nearly 17 billion miles.
“A global community can seem very abstract until you see its activities visually represented in your immediate location and across the world,” says Strava CEO James Quarles. “It’s not just runners and cyclists, either – skiers, hikers, kiteboarders and even mountaineers on Everest are all counted in the more than 1 billion uploads of the Strava community.”
The heatmap features data from 31 different activity types, spanning everything from kayaking to backcountry skiing. Strava Premium athletes can also access personal heatmaps, a unique way to visualize their activities over time. It shows everything from swims across the English channel to hikes on iconic trails in Patagonia to snowboarding in Japan. It’s also a tool athletes explore to find new places to play.
This window into the world of sport is taken a step further with Strava Metro, a tool that helps make riding, running and walking in cities better. Strava Metro anonymizes and aggregates data from the millions of activities shared on Strava each week, and then partners from departments of transportation and city planning groups use to improve infrastructure for bicyclists and pedestrians. A full set of Metro data enables deep analysis of activities such as popular or avoided routes, peak commute times, intersection wait times, and origin/destination zones.
“The Strava Heatmap is enlightening because it lets us connect the bike riders we spot on the streets with a broader perspective of our territory, over space and time,” says Jorge G. Coelho, Mobility Project Manager, AMAL, Portugal. “Strava Metro then gives us the possibility to dive much deeper, breaking down data minute-by-minute and segment-by-segment for the entire road network. It’s a bit like our Pasteis de Belém: they’re good to smell, but you have to really sink your teeth into them to fully take advantage.”
Download Strava for iOS or Android and upgrade to Strava Premium to access advanced features. To learn more about Strava, visit www.strava.com.
Strava’s stats:
- 16 activities uploaded every second, 11 million every week
- 100+ compatible mobile phones and GPS devices
- 140+ employees, most in San Francisco with more in Hanover and Bristol
- 1,100+ professional athletes are on Strava
- 1 million athletes join every 40 days
- 1.3 billion kudos given between athletes last year
- $7.99 a month to make the most of your sport with Premium, or $59.99 a year
- 100+ cities making commuting better with Strava Metro
See the new Strava Heatmap here, and learn more about Strava Metro here.


