
There’s more than meets the eye when it comes to the world’s fastest track cyclists generating optimum speed. At first glance a track bike appears to be a basic machine, comprising one fixed gear. There are no brakes – instead you scrub speed by slowing your pedalling rate. It couldn’t be more simple, right? Wrong. Dig a little deeper and you’ll discover frames spawned from computational fluid dynamics software, wind-tunnel research and lab testing, all in the name of producing the lightest, stiffest and most aerodynamic bikes possible.
Let’s start with material: carbon fiber, which strikes the track cycling sweet spot between low weight and maximum stiffness. And that stiffness is vital when you consider the forces generated from the cyclist through to the frame. Take the Netherlands’ Jeffrey Hoogland, who set a new flying 200m time-trial sea-level record of 9.448 seconds at June’s European Games in Belarus. Hoogland’s average headed towards 80km/hr, sending huge forces through the frame. If his frame had lacked stiffness, more energy would have been leached rather than projecting bike and rider forwards. And that would have meant no world record for the Dutchman.
The role of the airfoil
Hoogland’s power output is immense, touching 2000 watts. Frame material assists rather than impedes. As does a track cyclist’s frame shape. As a rider’s speed rises, so does air resistance; in fact, for every doubling of speed, air resistance rises by a power of four. That’s where the world’s leading aerodynamicists come in, researching and forging frames that reduce drag. And that leads us to teardrop-shaped tubing, which features on the majority of today’s track bikes.
Why is very much down to the work of Professor Ascher Shapiro in the 1950s, who showed that airflow is far more turbulent passing over round objects compared to a smooth airfoil, which is essentially a tapered tube. Aerodynamicist Simon Smart has shown that a teardrop tube generated 1/20th the drag of a cylindrical tube of similar diameter.
If that’s so, why do we not see huge fairings on the world’s finest track bikes? That’s down to UCI guidelines ensuring the impact of machine doesn’t overtake the impact of man, meaning the maximum height of tubing mustn’t eclipse 8cm with tubing thickness a minimum 2.5cm, reduced to 1cm for the chain and seat-stays. This 8:2.5 ratio equates to a 3.2:1 ratio. Studies show that a ratio of between 6:1 and 7:1optimises aerodynamics without too great a weight penalty. It’s why some manufacturers might design their tubes at, say, 5:1 but then carve off the end to adhere to UCI guidelines. This, it’s purported, cuts drag by creating a virtual tail.
The effect of air pressure
It’s clear that reducing air resistance is pivotal to maximising speed. But that’s just the start of air’s impact on track cyclists. Cue in air temperature and air pressure. In the build-up to Bradley Wiggins’ record-breaking UCI Hour Record attempt in June 2015, the 2012 Tour de France winner told reporters, “Much of the hour record is dictated by temperature and air pressure. I’m not a weatherman but if you have really low pressure – under 1,000 Hpa [grammes per cubic metre) – you’ll travel a lot further on the day. Anything up to an extra 1km for the same power.”
Warm air is also less dense than cold air and is why the team at the Lee Valley Velodrome, London, controlled temperature at a constant 28°C. It had the desired effect, Wiggins’ 54.526km surpassing Alex Dowsett’s mark of 52.937km, since bettered by Victor Campenaerts in April 2019, the Belgian’s 55.098km helped by the low pressure of his altitude attempt at the Velodromo Bicentario in Aguascalientes, Mexico.
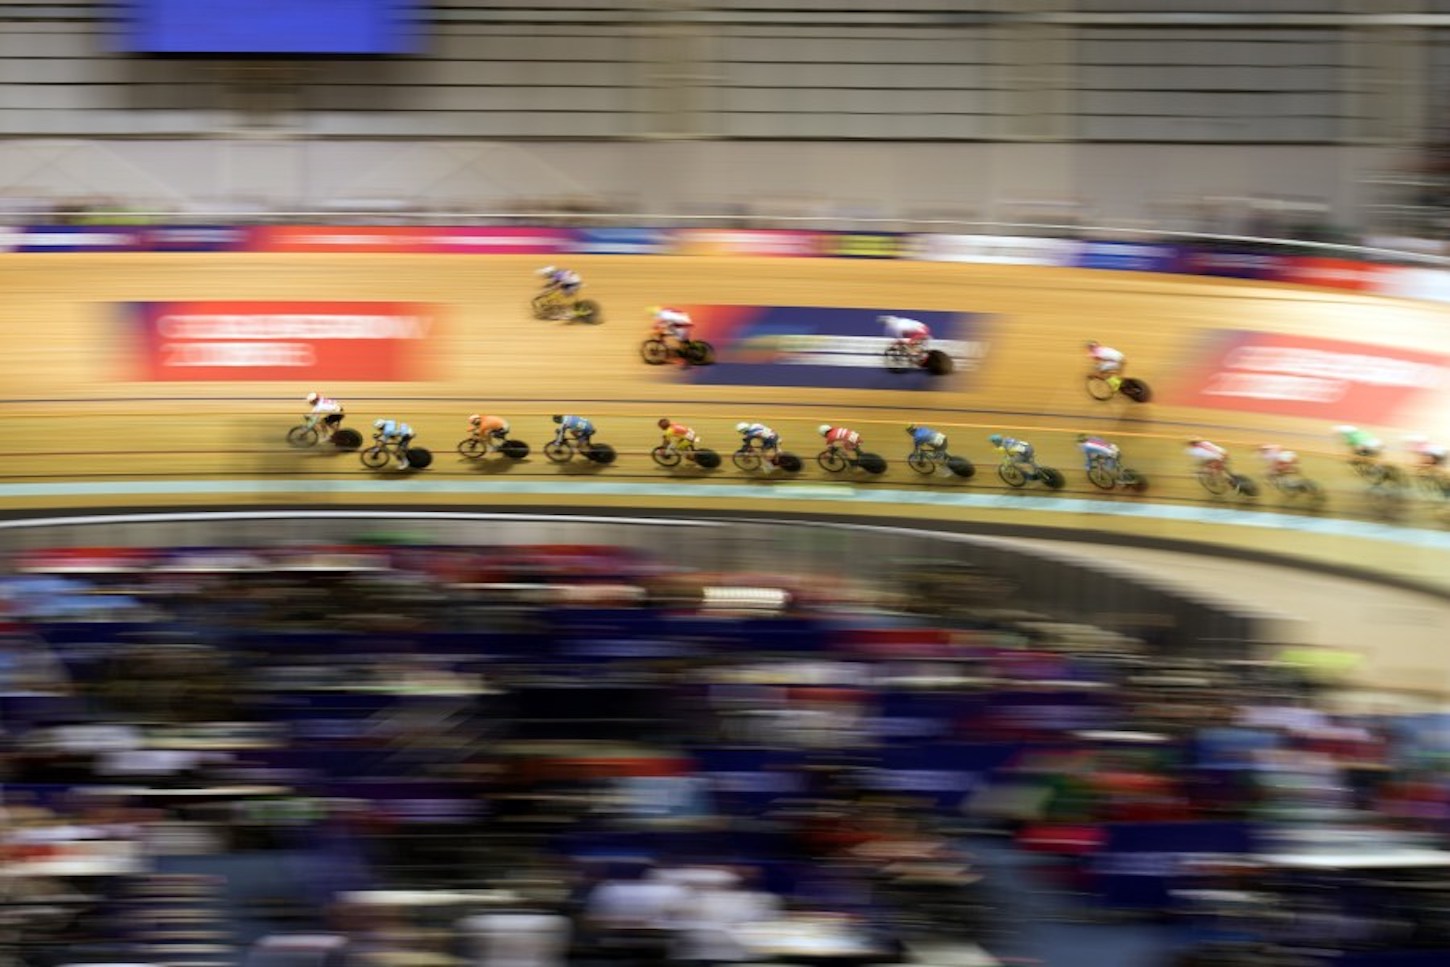
The shape of the track also influences the speed of the rider. Starting with the fundamentals, if track cyclists were to accelerate around a flat circular track, they’d find it near impossible to stay on. That’s where the banking comes in, the steepness dictated by the length of the track. The banking of a 250m track, for instance, might max out around 45°; a longer track of around 333.33m might max out at a shallower peak of around 32°. Ultimately, it’s a balancing act as sprint cyclists prefer a steeper back to generate peak speed, while endurance cyclists might prefer gentler angles to preserve energy.
The benefits of drafting
That principle of energy preservation carries over to the team events and, in particular, drafting. This is where the rear rider sits behind the front rider and benefits from the low-pressure wake created from the air passing over and around the front rider. It’s the closer the better when it comes to drag savings with wheel manufacturers Swiss Side showing that a rider sitting 10cm behind the rear wheel and cycling at 45km/hr saves 90 of the 250 watts required to reach that speed: that’s an enormous 39.5% energy saving. Not surprisingly, this dissipates the further back the second rider sits, but even at 20m back, Swiss Side showed 8.9% savings.
Professor Bert Blocken of Eindhoven University showed that the lead cyclists can also enjoy an energy-saving benefit from the drafting rider – around 1.5% if the following rider is 15cm back.
Successful track cycling is much more than one man or woman powering around an oval track as fast as possible. And their bikes are far from the simple machines they might appear at first glance. Yes, riders with low body fat, powerful muscles and efficient technique play a huge part in optimum performance, but so does the environment, the equipment and rider position. Track cycling really is the ultimate sporting mix of humans maximising machine and nature in harmony.


